
I wanted a scriptable bar graph generator for my PhD thesis that supported stacked and clustered bars, but couldn't find one that played well with latex and had all the features I wanted, so I built my own. I followed the scheme of Graham Williams' barchart shell script to have gnuplot produce fig output and then mangle it to fill in the bars. I added support for more than just two or three clustered datasets and support for stacked bars, as well as automatic averaging and other features.
The primary features include:
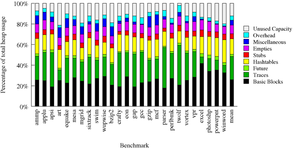
- Stacked bars of 9+ datasets
- Clustered bars of 8+ datasets
- Clusters of stacked bars
- Lets you keep your data in table format, or separated but listed in the same file, rather than requiring each dataset to be in a separate file
- Custom gnuplot command pass-through for fine-grained customization without having a separate tool chain step outside the script
- Bars can be pattern filled or use solid colors
- Font face control and limited font size control
- Automatic arithmetic or harmonic mean calculation
- Automatic legend creation
- Automatic legend placement in empty space inside the graph
- Automatic sorting, including sorting into SPEC CPU 2000 integer and floating point benchmark groups
- Error bar support
A tarball package that includes the bargraph script and sample graphs is available on BinTray.
See the official project home page for documentation and examples.