
DevTools

Debug with AI
Understand performance
Inspect resources
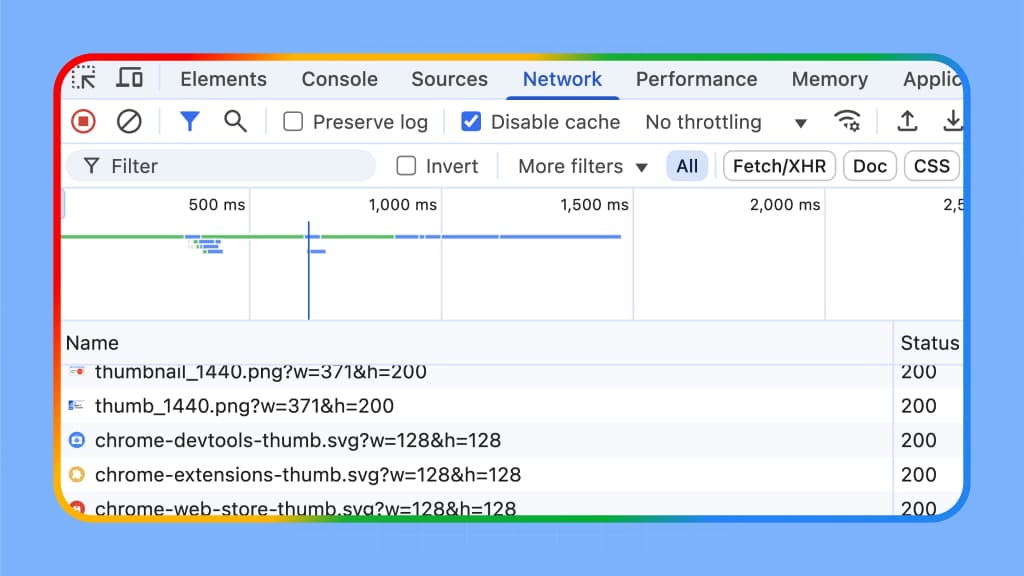
Analyze network
Debug with AI
Chat with AI assistance
Get code suggestions
Understand console messages
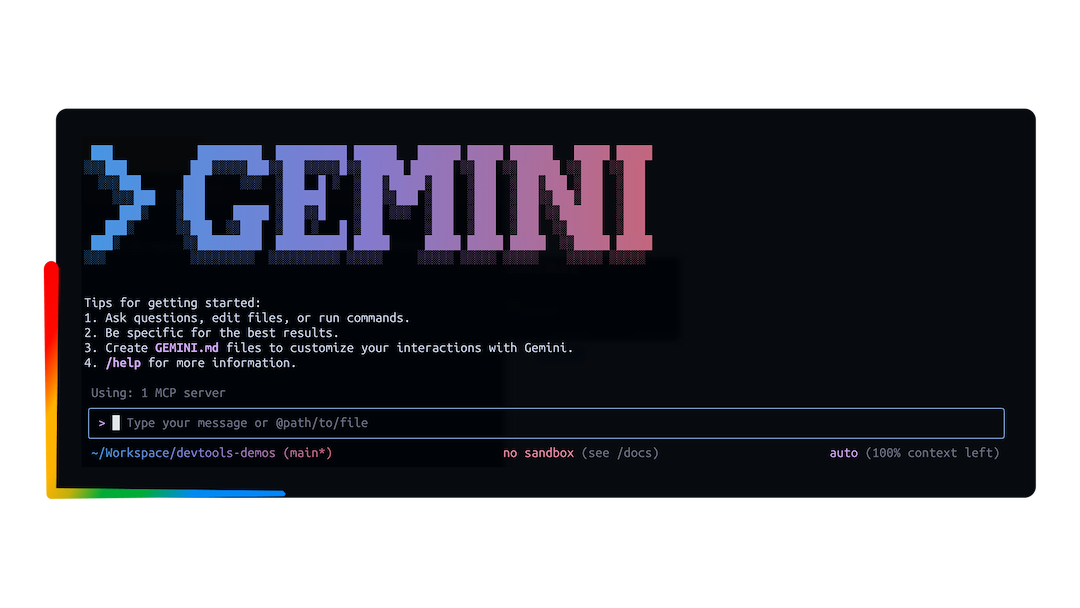
DevTools MCP
Connect the Chrome DevTools MCP (Model Context Protocol) server to your tool of choice: Gemini CLI, Claude Code, Cline, Copilot, and more.
Developer Tooling Tips
Performance optimization Pitstop
Pixel Pirate
AI innovations
Advanced Network Analysis with Chrome DevTools
Get performance insights
Performance tool overview
Monitor your local and real-user Core Web Vitals performance in DevTools
Insights sidebar in the DevTools Performance panel
News & updates

What's new in DevTools, Chrome 142
Updated October 28, 2025
Code suggestions in Console and Sources, full performance trace debugging with Gemini, toggle drawer orientation, DevTools MCP server updates, and more.
Deprecating live editing of JavaScript sources in Chrome DevTools
Updated October 22, 2025
Chrome DevTools removes live editing in Chrome 145 (Feb 2026) due to low use and modern alternatives like Hot Module Replacement (HMR).
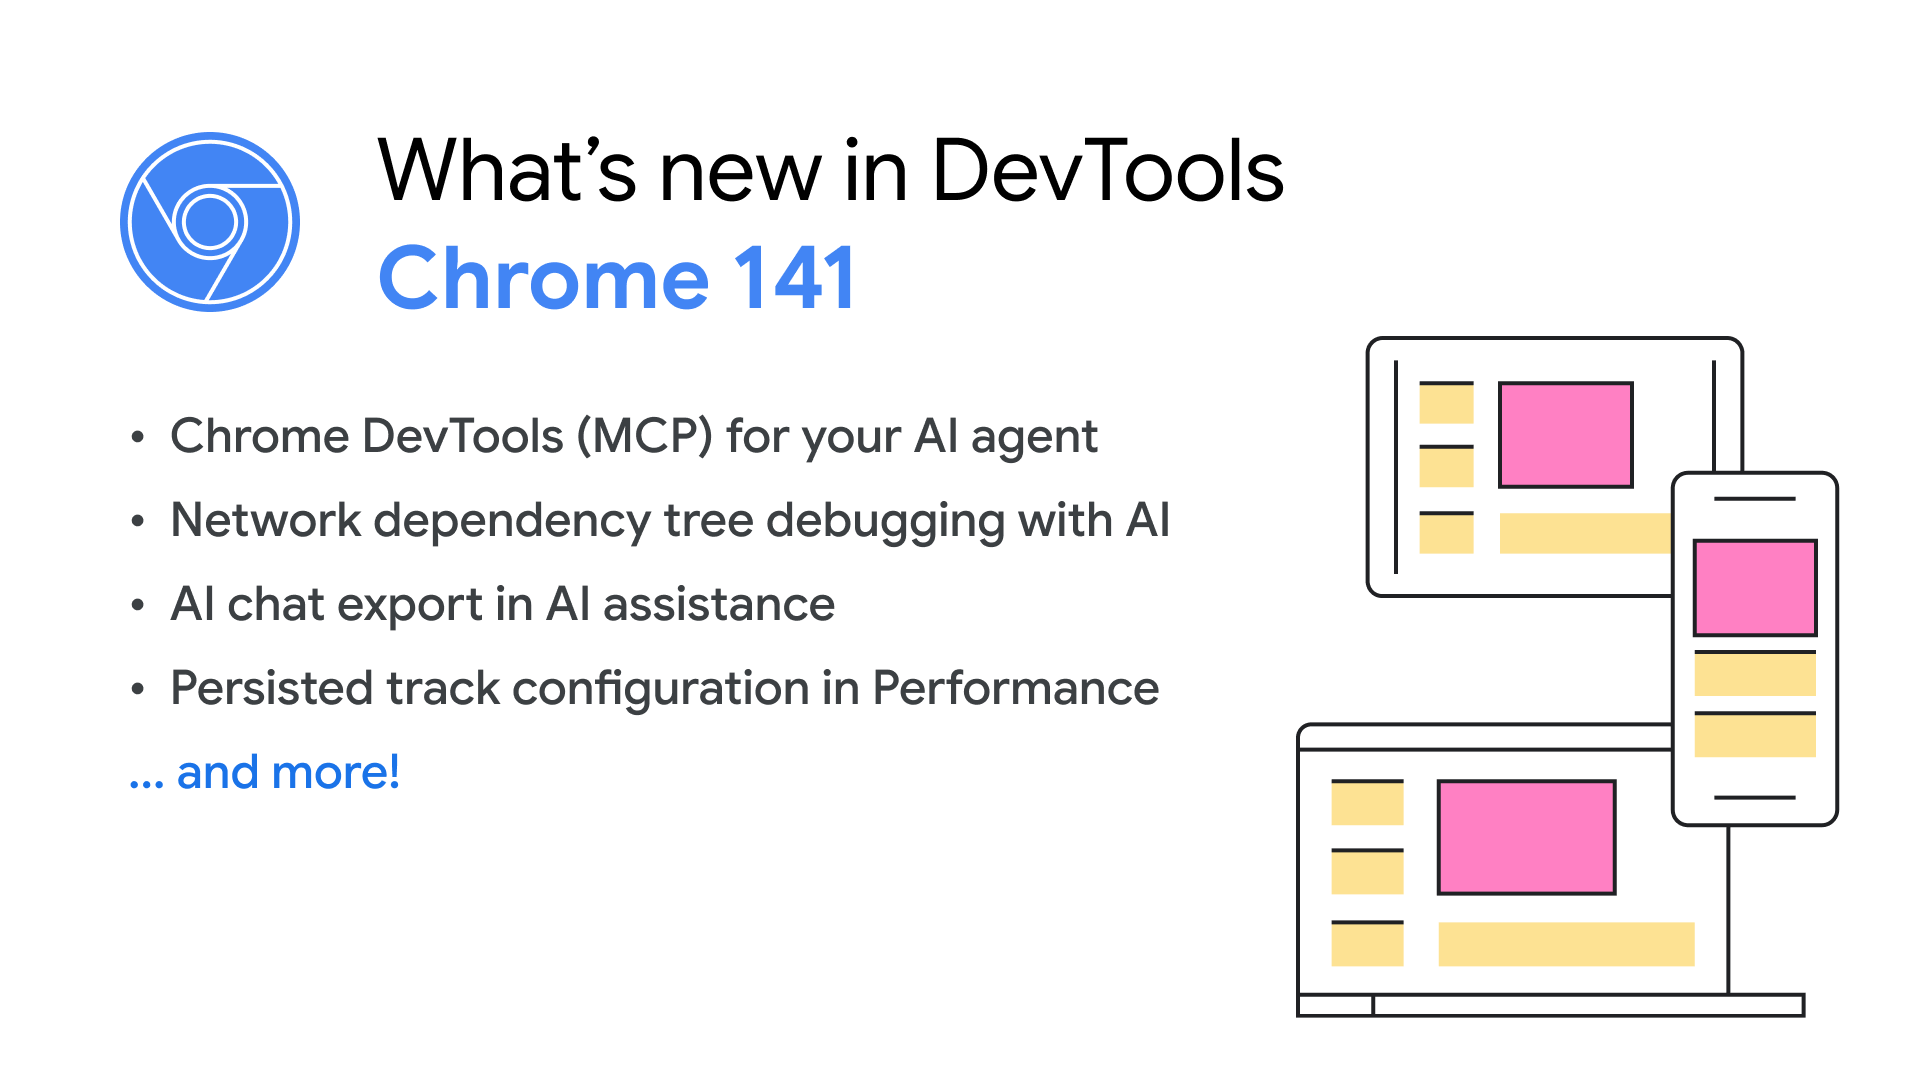
What's new in DevTools, Chrome 141
Updated September 30, 2025
Chrome DevTools (MCP) for your AI agent, network dependency tree AI support, AI chat export, persisted track configuration in Performance, and more.
Chrome DevTools (MCP) for your AI agent
Updated September 23, 2025
Public preview for the new Chrome DevTools MCP server, bringing the power of Chrome DevTools to AI coding assistants.
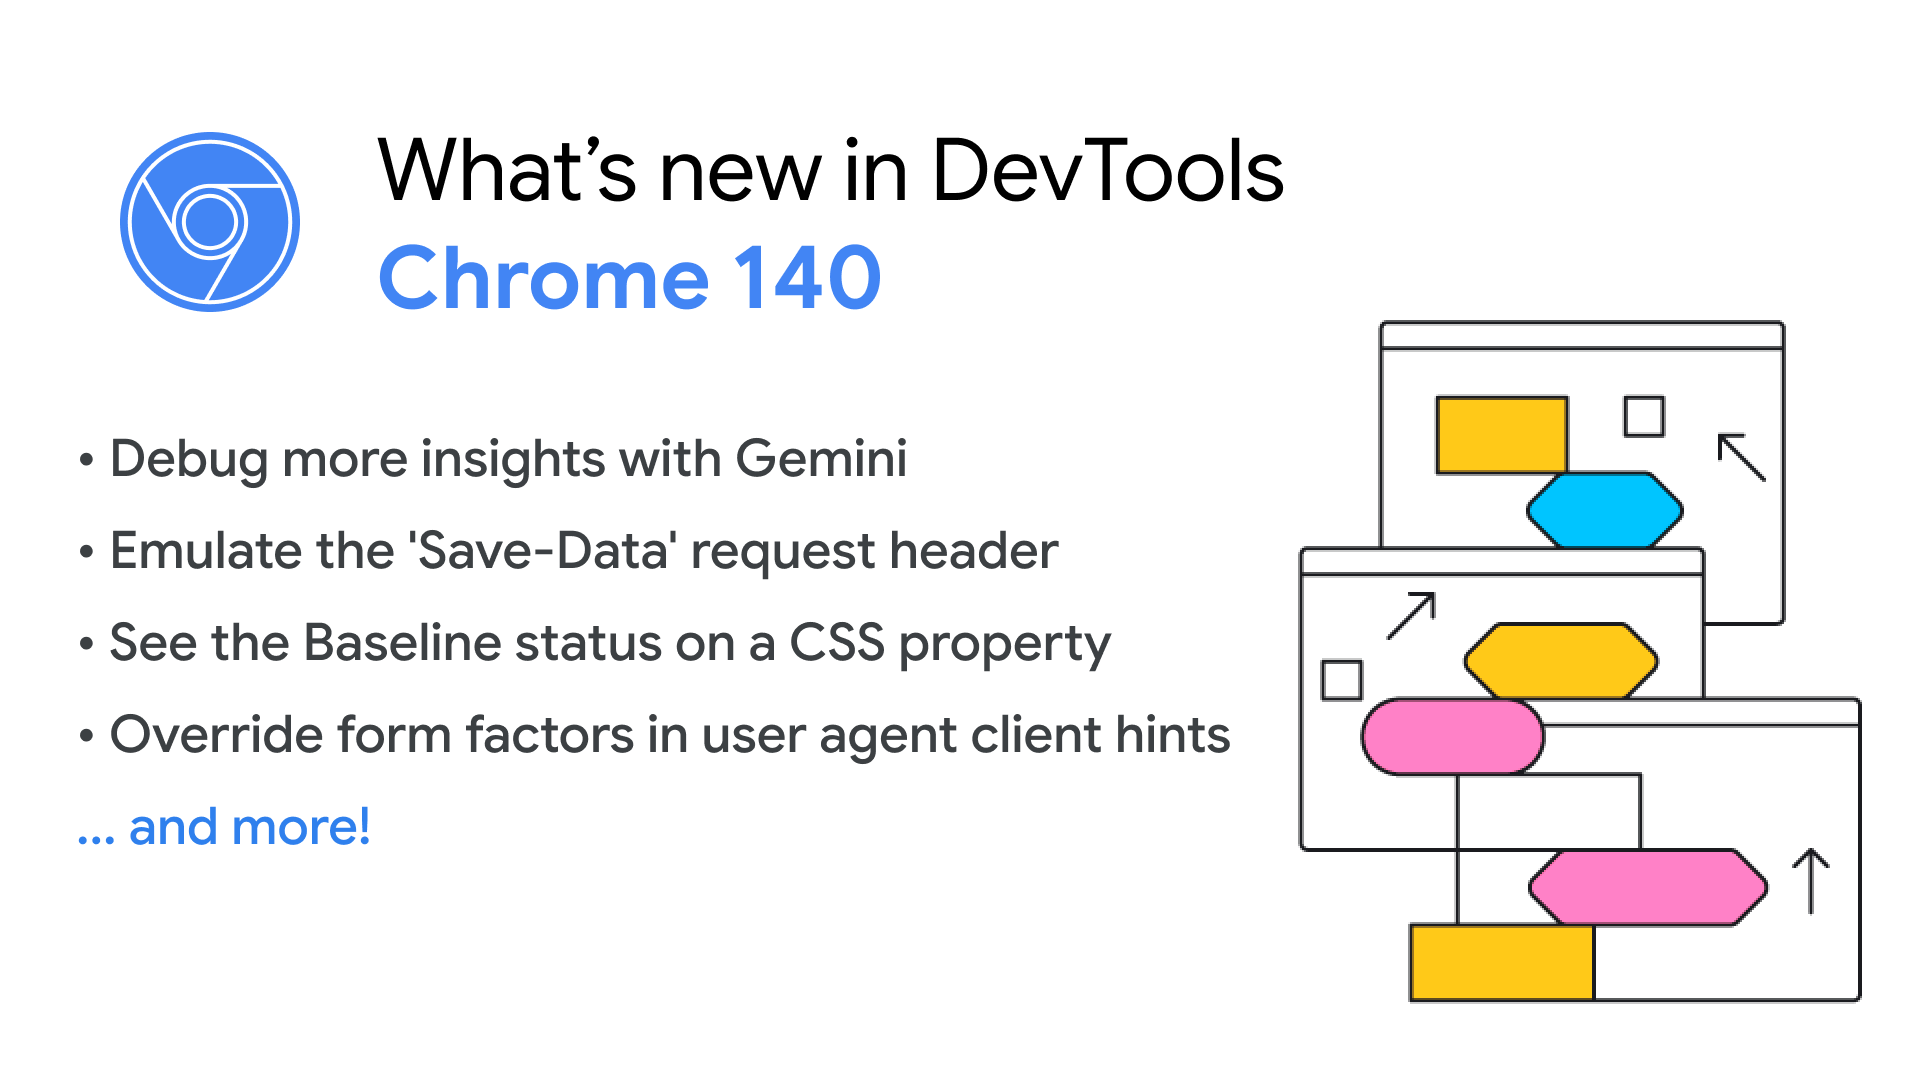
What's new in DevTools, Chrome 140
Updated September 1, 2025
Debug more insights with Gemini, emulate the 'Save-Data' request header, see the Baseline status in a CSS property tooltip and more.
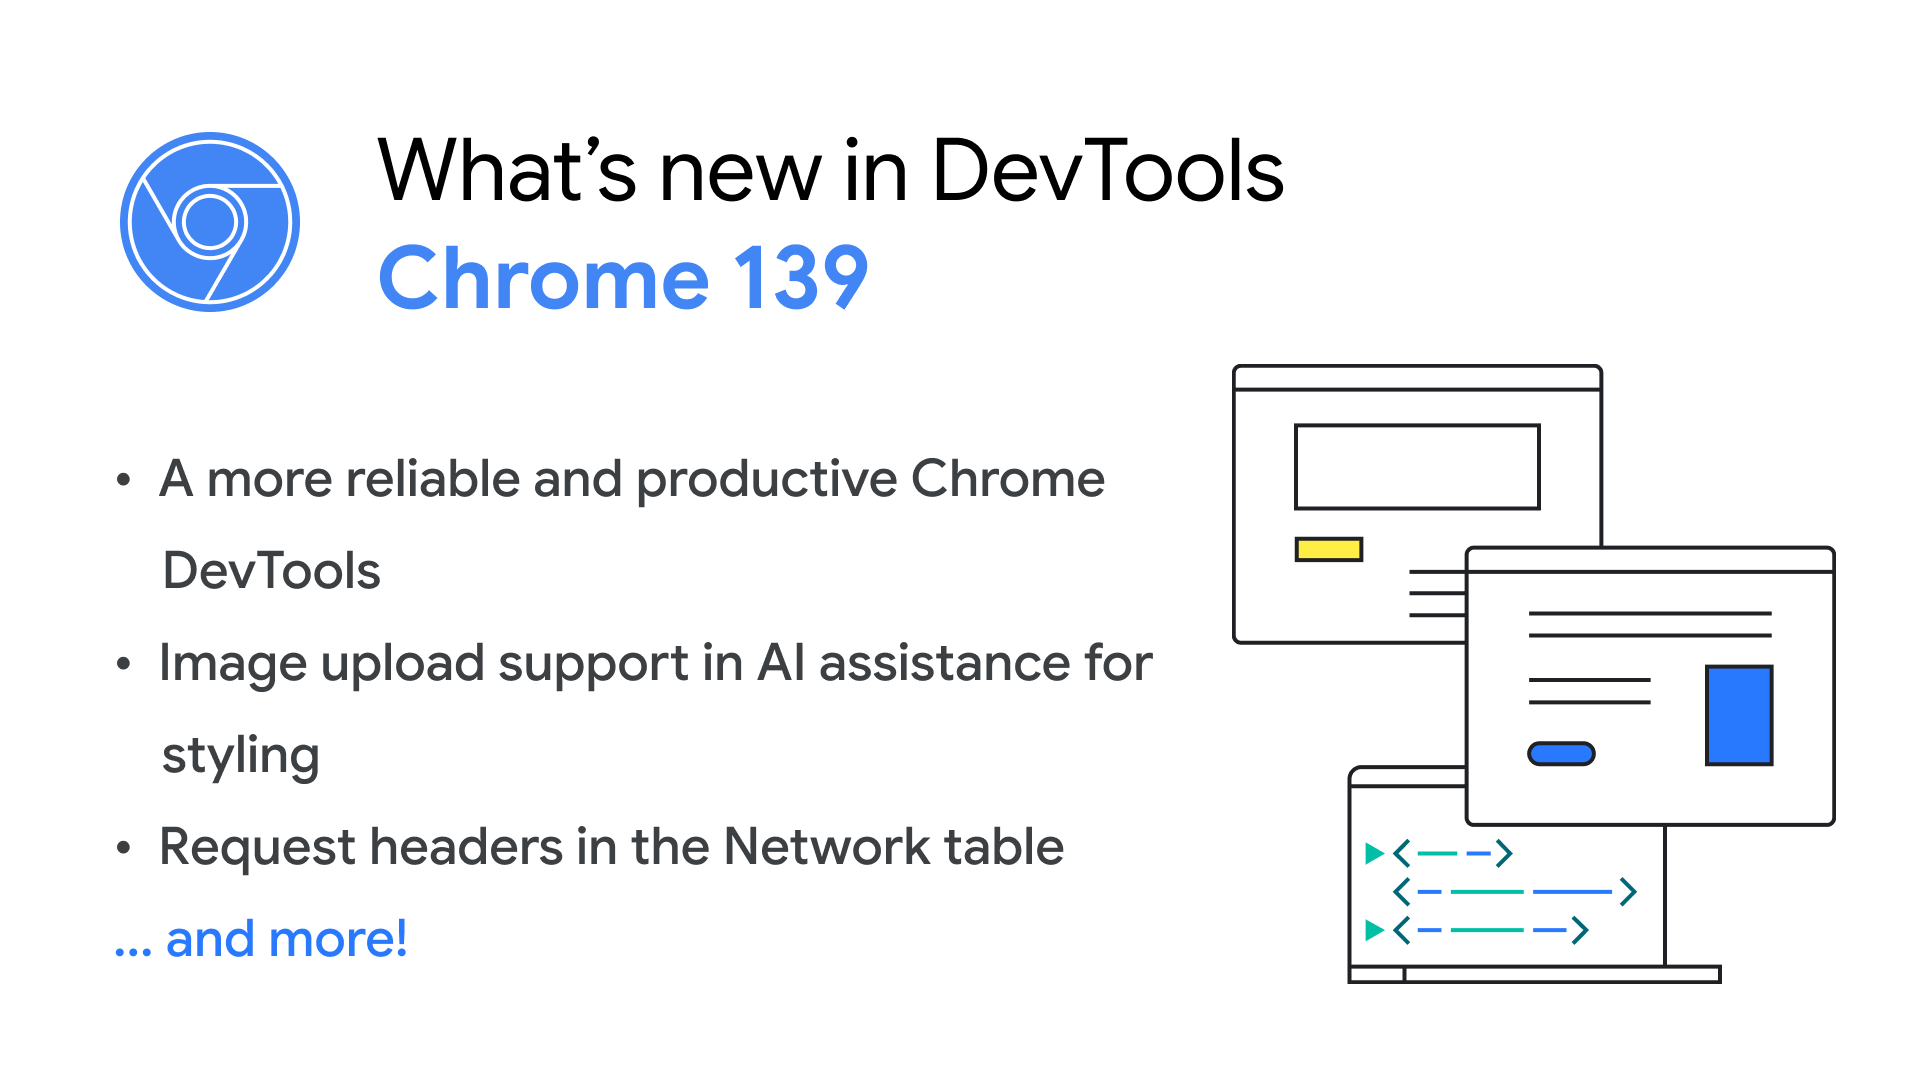
What's new in DevTools, Chrome 139
Updated July 22, 2025
A more reliable and productive Chrome DevTools, support for arbitrary image upload in AI assistance for styling, and more.

Use Chrome DevTools Performance panel to profile Angular apps
Updated July 14, 2025
Chrome DevTools and Angular collaborated to integrate Angular runtime data directly into the Performance panel, helping pinpoint performance bottlenecks.
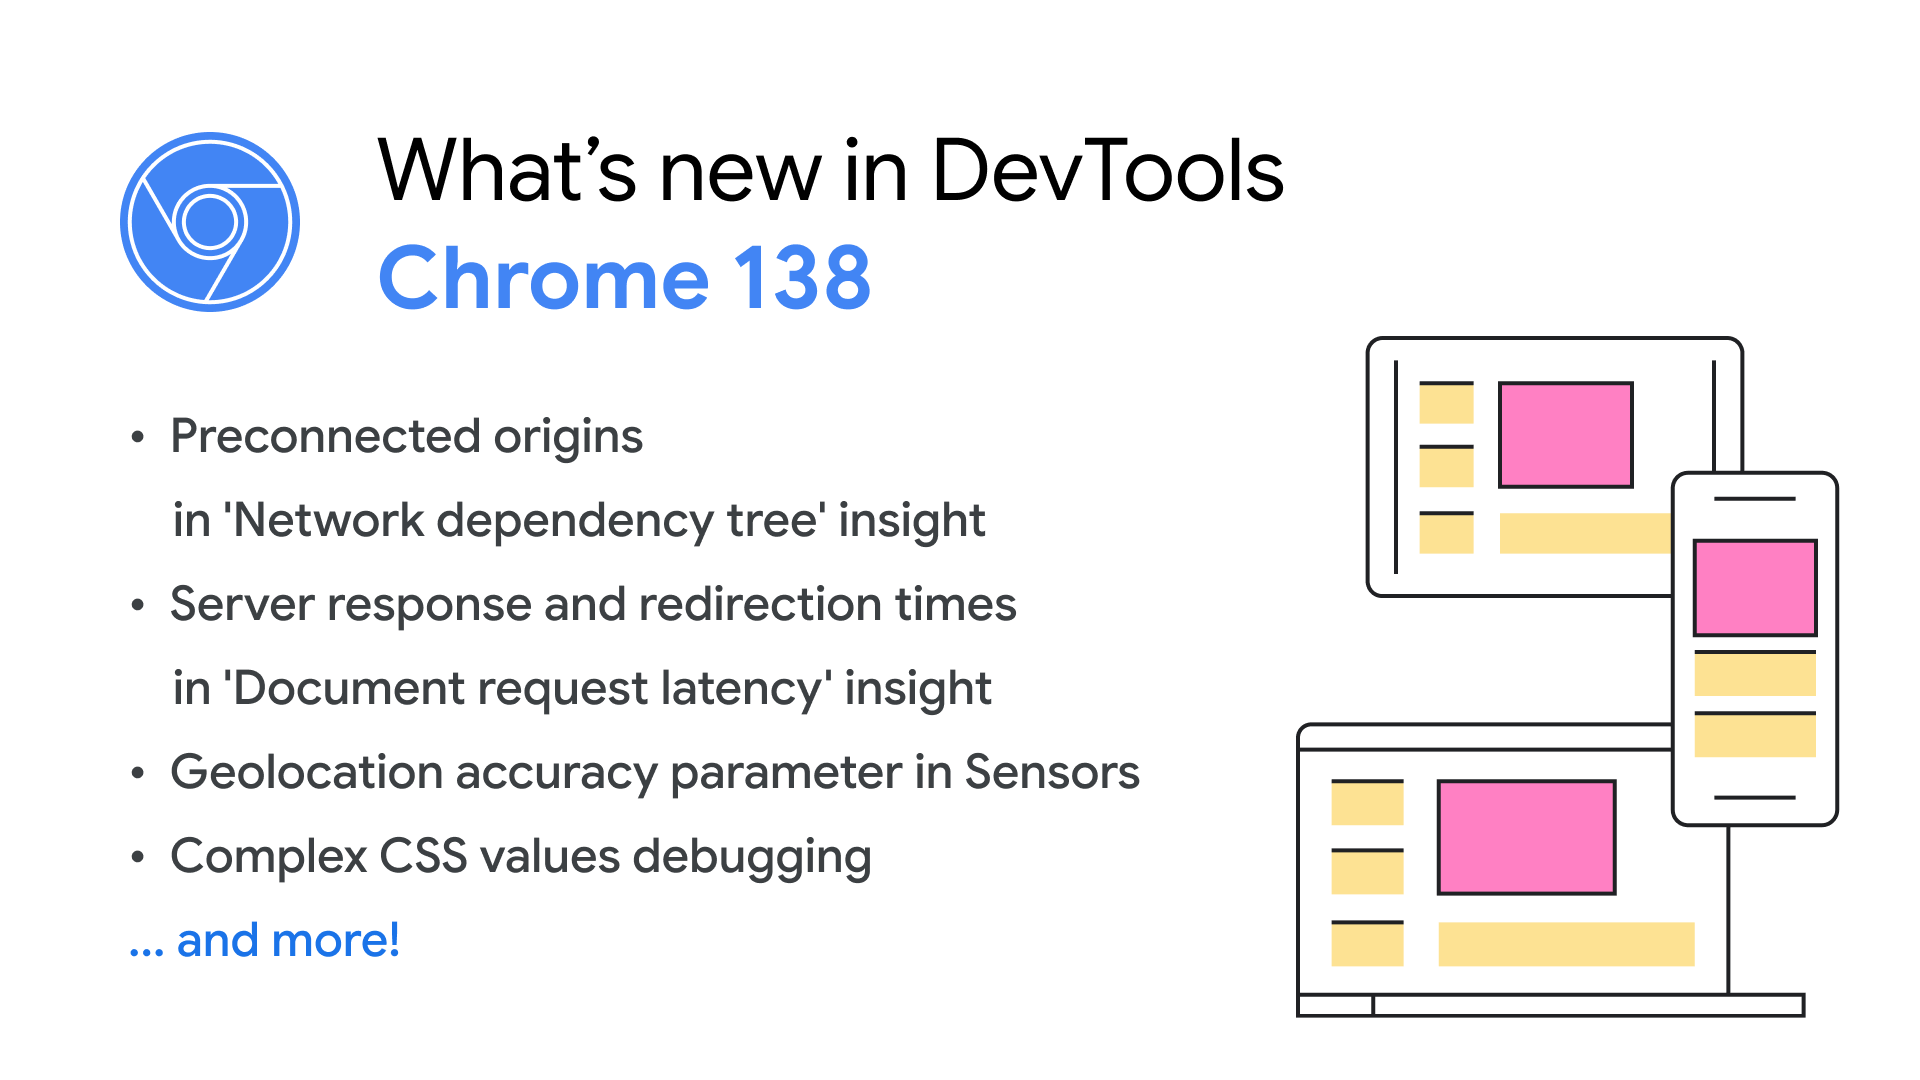
What's new in DevTools, Chrome 138
Updated June 17, 2025
Discover preconnected origins or candidates and server response and redirection times in performance insights, emulate geolocation accuracy in Sensors, debug complex CSS variables, and more.
What's new in DevTools, Chrome 137
Updated May 20, 2025
Use Gemini to modify and save CSS, learn about performance insights, annotate performance findings, and more.
Inspect and edit resources
Feature reference
Set up a workspace
Analyze network activity