Build awesome apps with Google’s knowledge of the real world
Create real-world, real-time experiences with the latest Maps, Routes, and Places features from Google Maps Platform. Built by the Google team for developers everywhere.
Explore top topics

Check out 7 new products announced at Google I/O ’23
From immersive experience products to advanced map customizations, see all the new products announced this year.

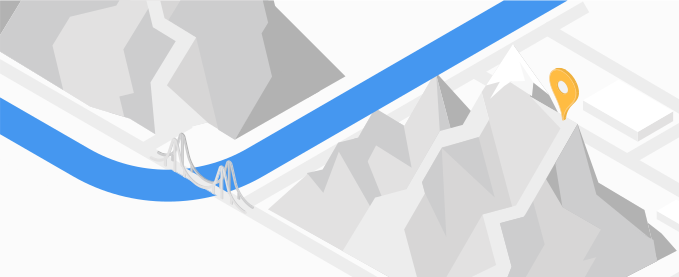
Aerial View API
Create immersive cinematic video experiences with Aerial View API.

Photorealistic 3D Tiles
Create immersive 3D map experiences with Photorealistic 3D Tiles.

New map customization capabilities
Build customized immersive geospatial experiences using advanced markers and new styling capabilities.
Read the docs
SDKs and APIs
Maps
Maps SDKs
Bring the real world to your users with dynamic maps for the web and mobile.
Static maps
Display a static map on your website.
Street view imagery
Add 360° Street View imagery to your apps.
Elevation
Get the elevation of one or a series of locations.
Aerial View
Create and display Aerial View videos rendered using Google's 3D geospatial imagery.
Map Tiles
Provides high-resolution Photorealistic 3D Tiles, 2D Tiles, and Street View Tiles.
Maps Datasets (Pre-GA)
Upload your data to a dataset for use in a Google Maps Platform app.
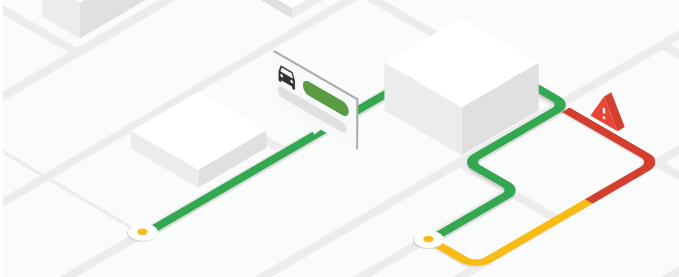
Routes
Routes
Performance optimized version of the Directions API and Distance Matrix API, with additional features.
Roads
Identify nearby roads using coordinates.
Directions
Provide directions for multiple transportation modes, featuring real-time traffic information.
Distance Matrix
Calculate travel times and distances for multiple origins and destinations.

Places
Places API & SDKs
Integrate Google’s Place details, search, and autocomplete into your apps.
Geocoding
Convert coordinates into addresses and addresses into coordinates.
Geolocation
Get an approximate device location using nearby cell towers and WiFi nodes.
Address Validation
Validate an address and its components.
Time zones
Determine the time zone for a set of coordinates.
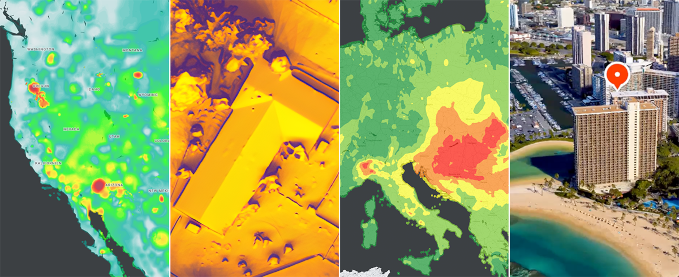
Environment
Solar
Look up the rooftop solar energy potential for specific buildings.
Air Quality
Retrieve air quality indexes, pollutants, and health recommendations for specific locations.
Pollen
Get pollen information for specific locations, including types, plants, and indexes.
Watch Google Maps Platform videos
Announcing Data-driven Styling Preview release
Engineering lead Elizabeth Muhm shows how you can use Data-driven styling to display and style Google boundaries on your maps.
Use Jetpack Compose with the Maps SDK for Android
Learn about the Maps Compose library that provides Jetpack Compose components in Kotlin for the Maps SDK for Android.
How Pulsepoint uses Google Maps Platform to save lives
See how the Pulsepoint Foundation uses Google Maps Platform in their app to locate and alert CPR-trained citizens about emergency situations.
Using React with the Maps JavaScript API
Learn how to how to load the Maps JavaScript API and place a marker on the map in React in just 5 minutes.
How to enable Google Maps Platform APIs and SDKs
Learn how to enable Google Maps Platform APIs and SDKs in the Google Cloud console. APIs and SDKs are available for Maps, Routes, and Places across web and mobile platforms.
Use Place Autocomplete in React apps
Learn how to add a Place Autocomplete input field to a React app.
Intro to Google Maps Platform
In this video, Angela Yu gives an overview of what's available through Google Maps Platform APIs and SDKs and shares some sample code for using them.
Full deck.gl integration with WebGL Overlay View
Engineering Lead Travis McPhail shares that deck.gl is now integrated with WebGL Overlay View, allowing you to create amazing 3D data visualizations.
Learn with Codelabs

Codelab: Building WebGL-Accelerated Map Experiences - JavaScript
Learn how to render 3D objects on the map with WebGL-powered maps features.

Codelab: Add a map to your mobile app with SwiftUI - iOS
Learn how to integrate the Maps SDK for iOS into your mobile apps using SwiftUI.

Codelab: Add a map to your Android app - Kotlin
Learn the basics of using the Maps SDK for Android.

Using Google Maps Platform with Flutter
Build a Flutter app with Google Maps Platform.
Join our developer community

Keep up-to-date on the latest news & tips from the Google Maps Platform team.
GitHub
Check out our open source utilities and example apps to help you build better and faster.
YouTube
Tutorials, tips, announcements, developer stories, and more.

Blog
All the latest in-depth news and stories from the world of Google Maps Platform.
Google Dev Library
Learn from a library of code and content contributed by developers around the world.

Discord
Get help from other developers and meet our team on the Google Maps Platform Discord server.
Get help & support
Stack Overflow
Get help. Give Help. Build Maps karma.

Issue Tracker
Report a bug or open a feature request.

Platform status
Find out about platform incidents and outages.

Support
Get help from the Support team. Choose the support service that works best for you.

Let’s get started
Getting started with Google Maps Platform is fast and easy.
Create a billing account. Enable the features you want. Get an API key. Start building.
Learn more in our getting started docs and videos.
Help shape the future of Google Maps Platform
Sign up to participate in research studies, even if you don't currently use our products.